Week 6 - Machine Learning
Model Selection, ML Diagnostic Method, DNN Diagnostic Method, Error Metrics for Skewed Classes, Vanishing / Exploding Gradient
Deciding What to Try Next
Errors in your predictions can be troubleshooted by:
- Getting more training examples
- Trying smaller sets of features
- Trying additional features
- Trying polynomial features
- Increasing or decreasing $\lambda$
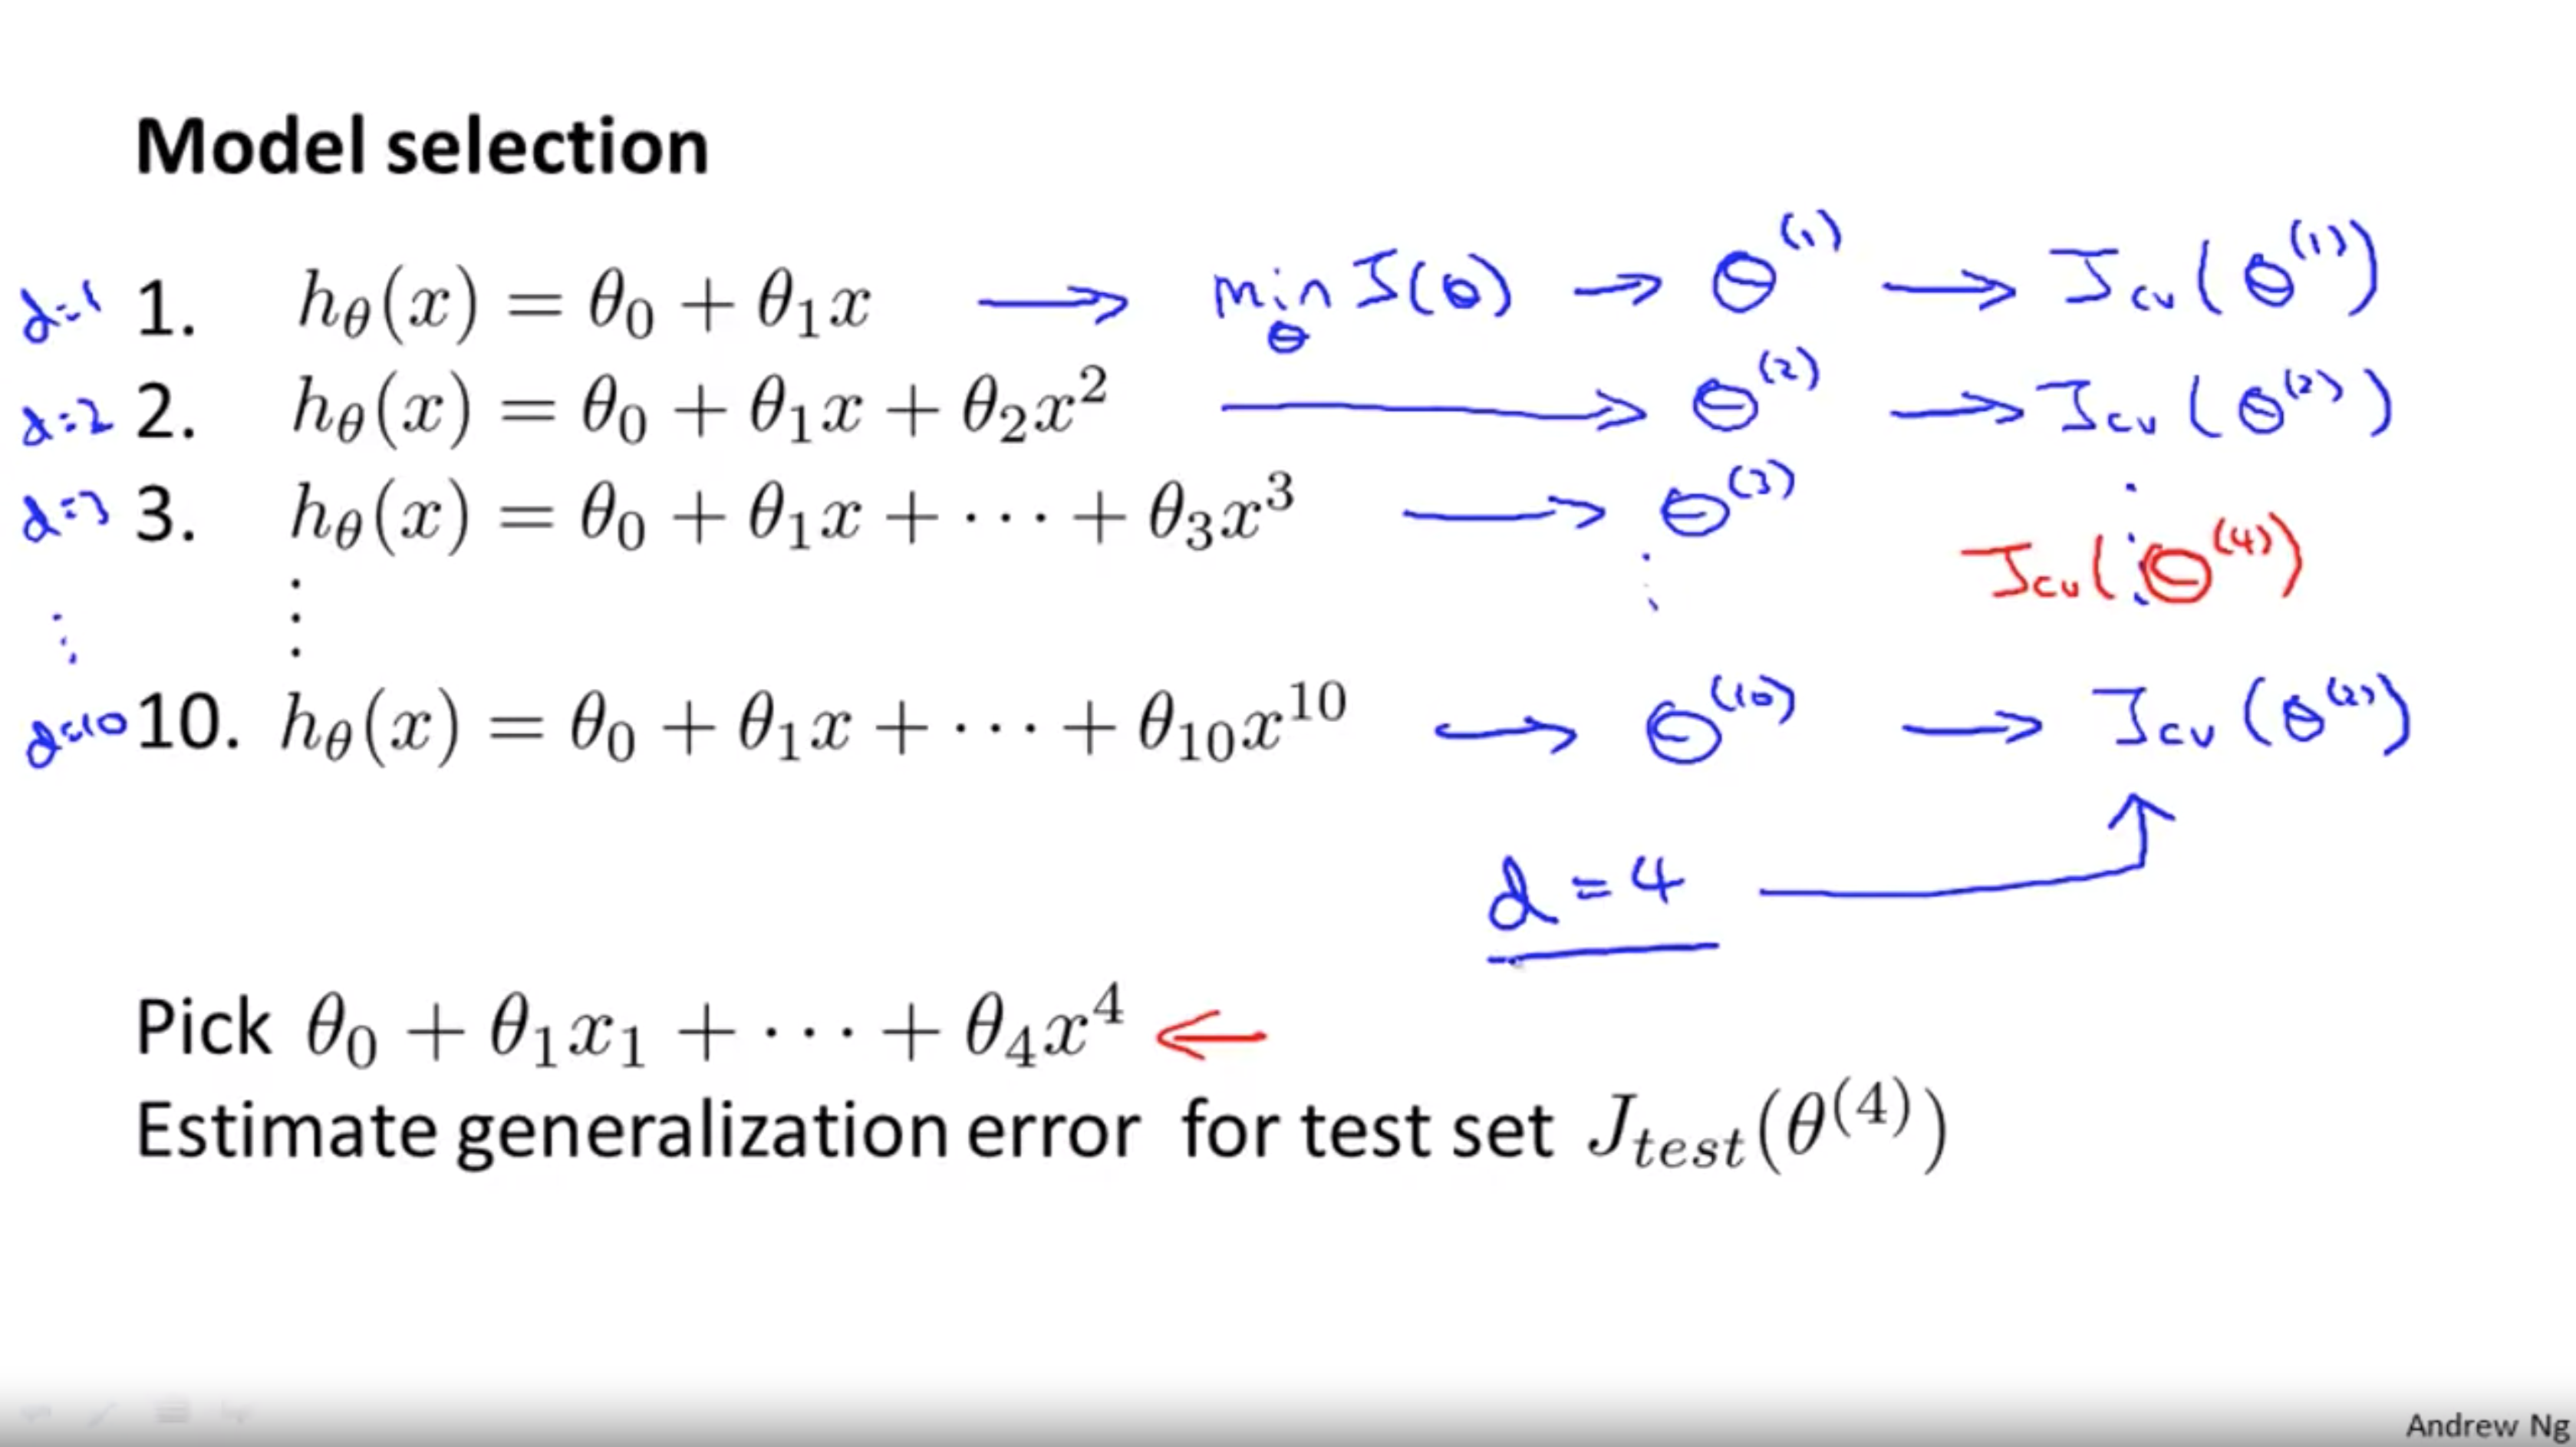
Model Selection and Train/Validation/Test Sets
Test Error
$$ J_{test}(\Theta) = \dfrac{1}{2m_{test}} \sum_{i=1}^{m_{test}}(h_\Theta(x^{(i)}_{test}) - y^{(i)}_{test})^2 $$
- Just because a learning algorithm fits a training set well, that does not mean it is a good hypothesis.
- The error of your hypothesis as measured on the data set with which you trained the parameters will be lower than any other data set.
Use of the CV set
To solve this, we can introduce a third set, the Cross Validation Set, to serve as an intermediate set that we can train d with. Then our test set will give us an accurate, non-optimistic error.
Model selection:
- Optimize the parameters in $\Theta$ using the training set for each polynomial degree.
- Find the polynomial degree d with the least error using the cross validation set.
- Estimate the generalization error using the test set with $J_{test}(\Theta^{(d)})$ (d = theta from polynomial with lower error);
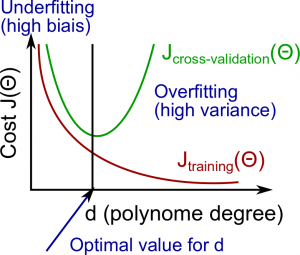
Diagnosing Bias vs. Variance
The training error will tend to decrease as we increase the degree d of the polynomial.
At the same time, the cross validation error will tend to decrease as we increase d up to a point, and then it will increase as d is increased, forming a convex curve.
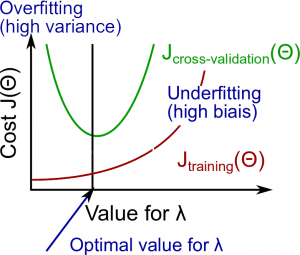
Regularization and Bias/Variance
- Large $\lambda$: High bias (underfitting)
- Intermediate $\lambda$: just right
- Small $\lambda$: High variance (overfitting)
In order to choose the model and the regularization $\lambda$, we need:
Create a list of lambdas (i.e. $\lambda \in\{0,0.01,0.02,0.04,0.08,0.16,0.32,0.64,1.28,2.56,5.12,10.24\}$);
Create a set of models with different degrees or any other variants.
Iterate through the $\lambda$s and for each $\lambda$ go through all the models to learn some $\Theta$.
Compute the cross validation error using the learned $\lambda$ (computed with $\lambda$) on the $J_{CV}(\Theta)$ without regularization or $\lambda = 0$.
Select the best combo that produces the lowest error on the cross validation set.
Using the best combo $\Theta$ and $\lambda$, apply it on $J_{test}(\Theta)$ to see if it has a good generalization of the problem.
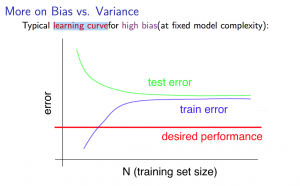
Learning Curves
With high bias:
Low training set size: causes $J_{train}(\Theta)$ to be low and $J_{CV}(\Theta)$ to be high.
Large training set size: causes both $J_{train}(\Theta)$ and $J_{CV}(\Theta)$ to be high with $J_{train}(\Theta) \approx J_{CV}(\Theta)$.
If a learning algorithm is suffering from high bias, getting more training data will not (by itself) help much.
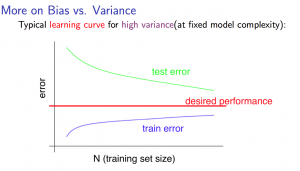
With high variance:
Low training set size: $J_{train}(\Theta)$ will be low and $J_{CV}(\Theta)$ will be high.
Large training set size: $J_{train}(\Theta)$ increases with training set size and $J_{CV}(\Theta)$ continues to decrease without leveling off. Also, $J_{train}(\Theta) < J_{CV}(\Theta)$ but the difference between them remains significant.
Deciding What to Do Next Revisited
| Method | Usage |
|---|---|
| Getting more training examples | Fixes high variance |
| Trying smaller sets of features | Fixes high variance |
| Adding features | Fixes high bias |
| Adding polynomial features | Fixes high bias |
| Decreasing $\lambda$ | Fixes high bias |
| Increasing $\lambda$ | Fixes high variance |
Diagnosing Deep Neural Networks
- A neural network with fewer parameters is prone to underfitting. It is also computationally cheaper.
- A large neural network with more parameters is prone to overfitting. It is also computationally expensive. In this case you can use regularization (increase $\lambda$) to address the overfitting.
Error Metrics for Skewed Classes
It is sometimes difficult to tell whether a reduction in error is actually an improvement of the algorithm.
- For example: In predicting a cancer diagnoses where 0.5% of the examples have cancer, we find our learning algorithm has a 1% error. However, if we were to simply classify every single example as a 0, then our error would reduce to 0.5% even though we did not improve the algorithm.
This usually happens with skewed classes.
For this we can use Precision/Recall
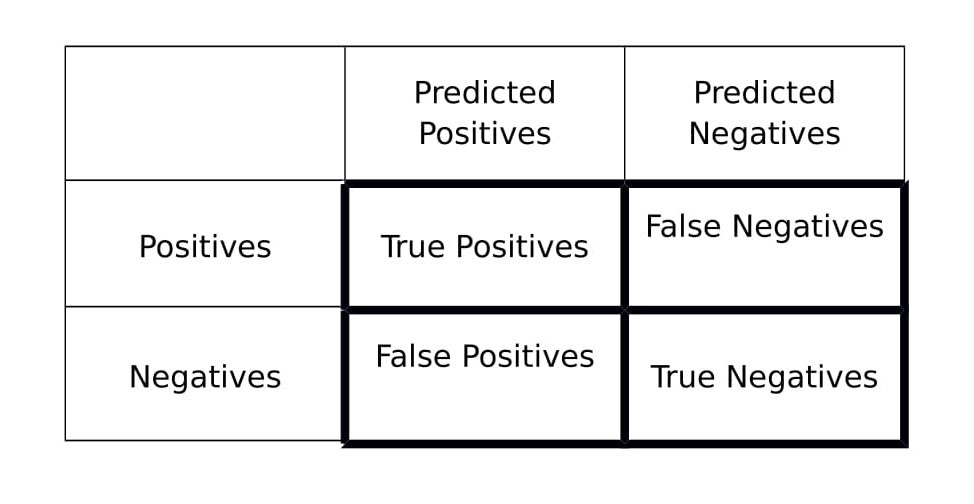
Precision: $$ \dfrac{\text{True Positives}}{\text{Total number of predicted positives}} = \dfrac{\text{True Positives}}{\text{True Positives}+\text{False Positives}} $$
Recall: $$ \dfrac{\text{True Positives}}{\text{Total number of actual positives}} = \dfrac{\text{True Positives}}{\text{True Positives}+\text{False Negatives}} $$
By setting the threshold higher (i.e, $h_\theta(x) \geq 0.7$ predict 1), you can get a confident prediction, higher precision but lower recall
By setting the threshold lower (i.e, $h_\theta(x) \geq 0.3$ predict 1), you can get a safe prediction, higher recall but lower precision
Use F score to leverage the two metrics: $$\text{F score} = 2 \frac{PR}{P+R}$$